LEV: Demystifying the New Vulnerability Metrics in NIST CSWP 41
In 2025, IT security teams are overwhelmed with a deluge of new security risks. The need to prioritize vulnerability remediation is an ongoing theme among IT security and risk analysts. In a haystack of tasks, finding the needles is imperative. Factors compounding this problem include a cybersecurity talent shortage, novel attack techniques, and the increasing rate of CVE (Common Vulnerabilities and Exposures) disclosure.

To meet this need for better precision and efficiency, a wave of new prioritization metrics has emerged. Not that more perspectives on risk are a bad thing, but already overwhelmed defenders find themselves in a difficult position; the choice between pushing forward or pausing to evaluate the value of new metrics.
Released by NIST (National Institute of Standards and Technology) in May 2025, the Likely Exploited Vulnerabilities (or just LEV) metric consolidates historical EPSS (Exploit Prediction Scoring System) time-series, and in-the-wild exploitation status, to compute, among other things, an aggregate risk score. In this article, we will take a dive into what LEV is and the supplemental equations released in NIST’s recent technical whitepaper (NIST CSWP 41).
The Reason Behind LEV (Likely Exploited Vulnerabilities)
LEV uses a CVE’s historical EPSS time-series to calculate a cumulative risk score representing the probability that it has ever been actively exploited. But how is this different from EPSS itself? Isn’t EPSS, a machine learning (ML) model with almost 1,500 predictive features, good enough?
Some academic criticisms have revealed that EPSS can miss critical vulnerabilities. Direct observation of historical EPSS data shows that scores can spike for a very short period of time (1-2 days), then return to a moderate or low baseline. This presents potential problems for defenders using EPSS.
For example, EPSS does not reflect how cybercriminals operate. Industry reports show that attackers exploite vulnerabilities whenever and wherever they are found, even old ones. In other words, attackers don’t say “Let’s not exploit that vulnerability because it’s too old”. Therefore, using only the most current EPSS score can hide severe risk, even those uncovered in the recent past. Defenders may solve this problem by always applying the highest EPSS score in their risk assessment. But another weakness still looms with raw EPSS scores: According to fundamental statistical theory, the accumulation of moderate probability scores should also signify high probability of an event occurring.
LEV addresses this last limitation by calculating a cumulative probability using each CVE’s historical EPSS data. LEV applies the common product-based approach for calculating cumulative probability of at least one event occurring among several independent events. As a result, CVEs which didn’t trigger alerts (even using the max EPSS) now appear as high-risk using LEV.
Mathematical Input and Symbol Reference
This section explains the input variables and mathematical symbols used in the LEV equations.
Input Reference
| A vulnerability (e.g., a CVE) | All equations | |
| d | A date (without time component) | All equations |
| d0 | First date with EPSS data for v | All equations |
| dn | The analysis date (usually today) | LEV, Expected Exploited, Composite Probability |
| dkev | Date of latest KEV (Known Exploited Vulnerabilities) list update | KEV Exploited |
| LEV (v,d0,dn) | Cumulative likelihood vulnerability v is exploited from d0 to dn | All equations |
| EPSS (v,dn) | EPSS score for vulnerability v on date dn | Composite Probability |
| KEV (v,dn) | 1.0 if v is in KEV list on dn, else 0 | Composite Probability |
| scopedcves | CVEs eligible for KEV tracking (where d0 ≤ dkev) | KEV Exploited |
| cves | CVEs considered in analysis (where d0 ≤ dn) |
Symbol Reference
| Symbol | Name | Meaning |
| ∀ | Universal quantifier | “For all” / “For every” similar to a programming loop. |
| Π | Capital Pi | A “Product notation” for repeated multiplication over a sequence, similar to how ∑ means repeated addition. |
| ∑ | Capital Sigma | A “Cumulative notation” for repeated addition over a sequence. |
| ∈ | Element of | “Is an element of” / “belongs to”. Indicates membership in a set. |
Understanding the LEV Equations
LEV is described by the “NIST Cybersecurity White Paper 41” (CSWP 41) as a lower-bound probability (conservative estimate) that a vulnerability has been exploited. It calculates the cumulative probability that a vulnerability has been exploited at least once during a given time window. Two similar equations are provided: LEV and LEV2. The first has been optimized to reduce CPU load.
In both the LEV and LEV2 equations, each term being multiplied by the product notation Π represents the probability that no exploitation occurred on a given day within the time window. This gives the cumulative probability of no exploitation ever. Subtracting this result from 1 inverts this probability, resulting in the probability of at least one exploitation over the time window.
The two LEV equations are described below:
The Performance Optimized LEV Equation
LEV uses a CVE’s historical EPSS scores, sampled every 30 days (epss(vi, di)), along with a compensating weight when the observation window is shorter than 30 days (i.e. dn < 30 days.
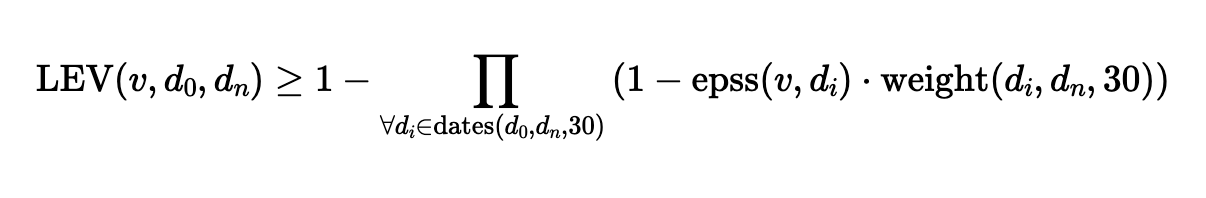
The LEV equation proposed in NIST CSWP 41
The High Resolution LEV2 Equation
LEV2 uses the complete historical EPSS time-series rather than sampling scores every 30 days. LEV2 applies weighting by dividing by the duration of the EPSS window (30 days). LEV2 increases the temporal resolution and produces a more reliable score. Short bursts of high EPSS cannot be skipped over, as can happen with the LEV equation shown above. Each daily EPSS value is scaled by 1/30 to preserve consistent risk density across the date range.
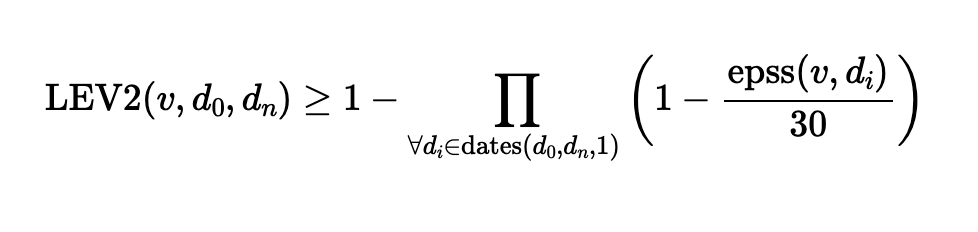
The LEV2 equation proposed in NIST CSWP 41
The Supplemental Equations
This section introduces the supplemental equations from NIST’s LEV whitepaper, their mathematical structure and potential use-cases.
Calculating a Composite Risk Score
The supplemental Composite Probability metric described in NIST’s LEV whitepaper simply selects the strongest available signal across three exploitation indicators: EPSS, inclusion in CISA’s (Cybersecurity and Infrastructure Security Agency) KEV list and LEV.

The Composite Probability equation proposed in NIST CSWP 41
By selecting the strongest intelligence signal, Composite Probability supports vulnerability prioritization. This helps reduce blind spots where one signal may be incomplete or outdated. It is especially valuable for prioritizing remediation in large enterprise vulnerability management programs, where choosing what to fix first is a critical challenge.
Estimating Total Number of Exploited CVEs
NIST’s whitepaper also suggests a method to estimate the total number of exploited CVEs during a specified time window and how to estimate the comprehensiveness of a repository of known exploited vulnerabilities.
The Expected Exploited Calculation
The Expected Exploited metric estimates the number of exploited CVEs within a given time window by summing all LEV probabilities from a defined set of vulnerabilities. The equation simply applies the sum (∑) of all LEV probabilities for a set of CVEs to estimate the total number of likely events. Although the NIST CSWP 41 describes it as a lower bound (conservative) estimate, there is no precedent for treating this basic technique as such. In probability theory, it is a fundamental principle that the expected number of events is equal to the sum of the individual event probabilities.
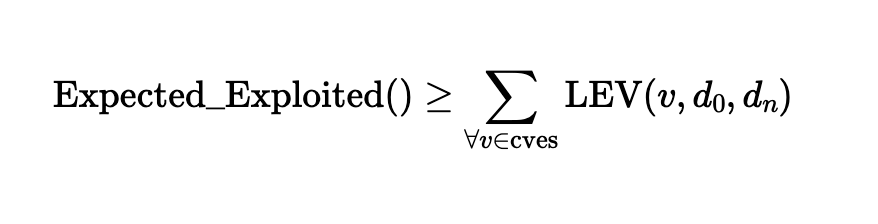
The Expected Exploited equation proposed in NIST CSWP 41
The KEV Exploited Calculation
The KEV Exploited metric estimates how many vulnerabilities are missing from a KEV catalog such as CISA KEV. Quantifying the gap between Expected Exploited and KEV Exploited gives insight into potential underreporting of a KEV catalog. The equation uses the same technique as the Expected Exploited equation above: the sum of all probabilities.
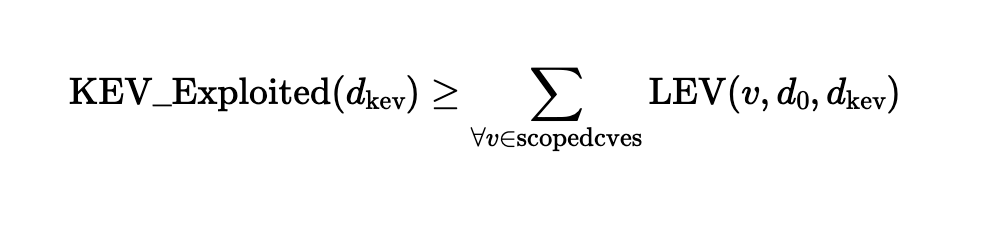
The KEV Exploited equation proposed in NIST CSWP 41
The Revelations of LEV
Here are some ways to visualize the value that LEV can provide to a vulnerability management program. The supplemental Composite Probability equation is best for visualizing the contribution that LEV makes to a more comprehensive CVE risk analysis. Therefore, the observations below all use Composite Probability unless otherwise stated.
The Estimated Total Number of Exploited CVEs
When considering all CVEs since ~1980 (273,979), LEV’s Expected Exploited metric shows that 14.6% of all CVEs (39,925) are likely to have been actively exploited in the wild. This implies that the vast majority of exploitation activity is not accounted for in any known KEV list (e.g. CISA KEV included 1,228 at the time of calculation). However, Expected Exploited does not account for how many individual CVEs may be uncovered at various EPSS thresholds.
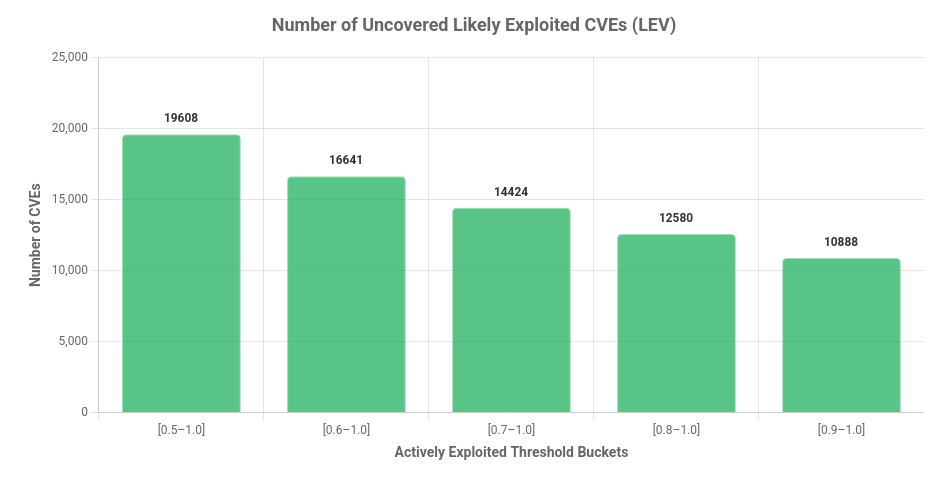
The Number of Uncovered High Risk CVEs
To assess how LEV may impact an organization’s ability to uncover risk and prioritize remediation, it is useful to consider how many CVEs are elevated to high risk status at various probability thresholds. The chart below shows how many CVEs would become visible above 50% Composite Probability.
Visualizing Risk Migration Using Composite Probability
The Sankey diagram compares the number of CVEs in each risk level. The left side shows maximum EPSS scores, while the right side shows LEV’s Composite Probability. Because Composite Probability is used, by rule, no CVEs can move to a lower probability bucket. The chart reveals a significant shift from the lowest risk bucket to higher risk categories, along with a increase for all other groups when using Composite Probability to estimate risk.
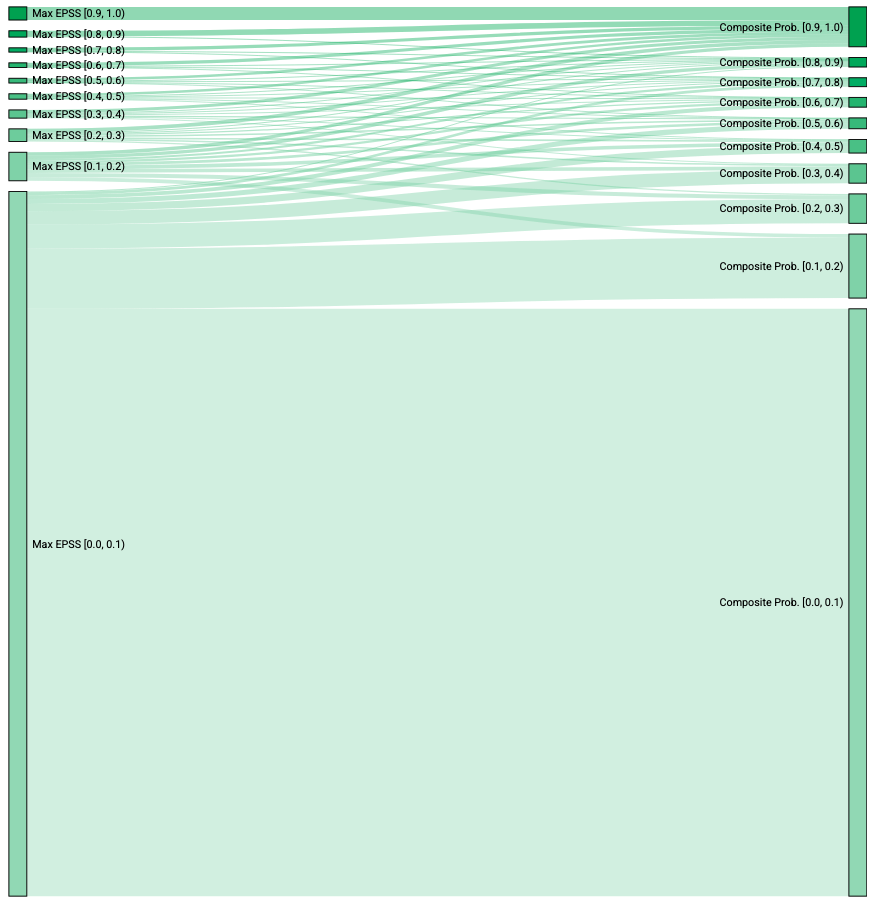
Sankey diagram showing the migration CVEs between risk buckets when using max EPSS and LEV’s Composite Probability metric
Limitations and Criticisms of LEV
While LEV offers valuable insights, it’s important to examine its assumptions and potential shortcomings:
- The LEV whitepaper does not present empirical validation or comparisons with other statistical models. However, a frequentist approach, using product-based probability, is a well-established method for calculating cumulative probability for a set of independent events.
- LEV is described as a lower-bound probability. However, there is no academic precedent claiming that the mathematical constructs in NIST CSWP 41 are conservative lower-bounds estimates.
- LEV is not an opaque prediction system in itself, but it is based on EPSS, which is not a fully public model. While LEV addresses some potential blind-spots, it does depend on EPSS. As EPSS improves, LEV will also benefit from these improvements. For example, EPSS v4 has added malware activity and endpoint detections to its “ground truth” of exploitation in the wild. This will reduce bias towards remotely accessible network vulnerabilities.
- Defenders should not over-rely on LEV, EPSS, or CVSS to prioritize vulnerabilities. While evidence of active exploitation is the strongest risk signal, this evidence often comes post-hoc – too late for defenders to leverage.
Summary
LEV may offer some enhancements to vulnerability prioritization by aggregating historical EPSS signals into a cumulative exploitation probability. This approach increases visibility for CVEs with a historical duration of moderate EPSS scores. Perhaps the most useful metric is the proposed Composite Probability, which will select the strongest signal from LEV, EPSS, and CISA KEV exploitation status.
Joseph has had a varied and passionate background in IT and cyber security since the late 1980s. His early technical experience included working on an IBM PS/2, assembling PCs and programming in C++.
He also pursued academic studies in computer and systems engineering, anthropology and an MBA in technology forecasting.
Joseph has worked in data analytics, software development and, in particular, enterprise IT security. He specialises in vulnerability management, encryption and penetration testing.